Abstract
Vitamin C (ascorbic acid) is a water-soluble vitamin that is essential for its antioxidant properties. It serves many roles in the body such as the repair and maintenance of tissues as well as the biosynthesis of important chemical substances. Green leafy vegetables and fruits are rich sources of ascorbic acid. Vitamin C deficiency causes scurvy, which is characterised by bleeding gums and delayed wound healing. Vitamin C is a delicate compound that is easily affected by conditions such as heat, air and temperature. This paper aimed at establishing the effects of processes such as canning and freezing on the concentrations of ascorbic acid in peas and carrots. Spectrophotometry was used to find the concentration of ascorbic acid by measuring the intensity of the blue colour produced when Folin-Ciocalteu (an oxidising agent) was reduced by ascorbic acid. A standard calibration curve for the absorbance of vitamin C was made using different known concentrations of ascorbic acid. Ascorbic acid was extracted from fresh, canned, and frozen samples of peas and carrots. Three replicates of these vegetables were made to warrant the reproducibility of the results. The extracts were run together with ascorbic acid standards and the absorbance read at 700 nm. Plots of absorbance against concentration were made and used to establish the concentrations of ascorbic acid. Statistical analyses were done using Microsoft Excel 2007. It was observed that frozen vegetables had the highest concentration of vitamin C followed by canned vegetables. Fresh vegetable samples had the least concentrations of ascorbic acid. The differences in ascorbic acid concentrations between canned and frozen and frozen and fresh vegetables were found to be statistically significant (at α=0.05). It was concluded that freezing was the best method of preserving vitamin C and that the residual concentration was sufficient to meet the daily nutritional requirements.
Introduction
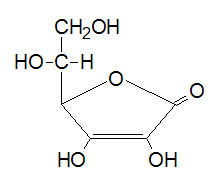
Vitamin C is a water-soluble vitamin that is extremely useful for its antioxidant properties (Naidu 2003). It is a lactone comprising of six carbon atoms.
Vitamin C has numerous functions in the body including the biosynthesis of neurotransmitters, carnitine, and collagen. It is essential in the repair and maintenance of bones and tissues. Its antioxidant properties preclude the oxidation of unsaturated fatty acids in the body thus lowering blood levels of cholesterol (Padayatty et al. 2003). This plays a significant role in the reduction of heart diseases and other complications relating to high fat levels in the body such as cataracts, cancers, and ailments of the joint (Padayatty et al. 2003). The reducing properties of vitamin C make it a donor of electrons for numerous enzymes such as monooxygenases and dioxygenases (Padayatty et al. 2003). Studies carried out by Hemila indicate that vitamin C treats common colds (1992). Its antioxidant properties neutralize the oxidising agents produced by phagocytic leucocytes during infections. This significantly lowers the progression of common colds and alleviates its symptoms. According to Cass and English, vitamin C sales skyrocketed after Linus Pauling published a book about the effects of vitamin C and common colds (2002). This book revealed that taking high amounts of vitamin C reduced the frequencies of common colds (Cass & English 2002).
Vitamin C is such an important vitamin that most animals synthesize it from glucose in their bodies. However, apes, bats, guinea pigs, and human beings lack gulonolactone oxidase, a crucial enzyme in the pathway for vitamin C biosynthesis and, therefore, cannot synthesize it (Naidu 2003). This means that the vitamin requires to be supplemented daily in meals, in these animals. Consequently, post-operative patients receive between 100 mg and 300 mg of ascorbic acid daily to prevent hypovitaminoses (Rumelin 2006). This is because vitamin C is significant in facilitating the process of wound healing by augmenting the cross-linking of lysine, hydroxylysine, proline, and hydroxyproline residues in the structure of collagen, a connective tissue (Padayatty et al. 2003). In addition, ascorbic acid has a high turnover rate and cannot be stored in the body (Naidu 2003). Therefore, it is vital that the vitamin is provided adequately and regularly to maintain its concentration in the body.
Rich sources of vitamin C include green leafy vegetables such as broccoli, mustard greens, turnip greens, collard greens, peas, and cauliflowers (Vitamins, Minerals and Supplements, 2013). Fruits such as papaya, strawberries, pineapples, kiwifruits, grapefruits, oranges, raspberries, tomatoes, and oranges are also excellent sources of vitamin C. The recommended dietary allowances of vitamin C are about 90 mg for adults above the age of 18 and 25 mg for children below 8 years (Vitamin C 2011). However, the RDA values increase to about 120 mg in lactating women above the age of 19 years. Certain factors such as smoking, stress, alcoholism, infection by viruses, and fevers cause a significant drop in the levels of ascorbic acid in the blood. Cigarette smoking produces free radicals and reactive oxygen species that deplete ascorbic acid. Consequently, smokers require a daily intake of about 140 mg of ascorbic acid. Certain health conditions such as Parkinson’s disease, asthma, depression, autism, diabetes, acne, irritable bowel disease, and Alzheimer also require an increased intake of vitamin C (Singh, Sharad, & Kapur 2004).
The key dietary forms of vitamin C are L-ascorbic acid and dehydroascorbic acid. According to Rumelin, dehydroascorbic acid reaches the intracellular compartment (the cytoplasm) faster than ascorbic acid and is thereafter oxidised to ascorbic acid (2006). This process plays a shielding role in the protection of cells during oxidative stress. Absorption of the nutrient takes place by active transport and is optimal at plasma levels of 100 mg. A five-fold increase in the concentration of the vitamin significantly decreases its absorption. Ascorbic acid interacts in a synergistic manner with several nutrients, for example, vitamin E and iron. Vitamin C augments the uptake and metabolism of iron and regeneration of vitamin E (Kreider et al. 2009). The presence of vitamin C also prevents the toxicity of vitamin A.
The deficiency of ascorbic acid manifests in an illness known as scurvy. The symptoms of scurvy include bleeding gums, ruptured vessels and poor healing of wounds. Respiratory infections are, in addition, common in vitamin C deficiency since ascorbic acid protects the lining of the respiratory tract (Kreider et al. 2009).
Vitamin C is an extremely volatile nutrient and is easily affected by changes in the atmosphere such as heat, light and water. The stability of vitamin C in food is influenced by the pH of the food. Maximum stability is seen between a pH of 4 and 6 (Naidu 2003). Keeping fruits and vegetables for long durations can destroy the quality and amount of vitamin C in foods (Haas 2011). Many parts of the world such as Mexico and Brazil face a challenge of obtaining adequate vitamin C, despite the ready availability of vitamin C-rich foods in the market. People in most developed countries consume processed vitamin C-rich foods and yet some of them still suffer from vitamin C deficiency. According to Padayatty et al., about 85% of Latino children in America do not attain the recommended dietary allowances of vitamin C (2003). This occurrence suggests that processing has an effect on the availability of vitamin C in vegetables. Vitamin C can also be obtained in the form of nutritional supplements. However, risks such as toxicity are associated with excessive intake of vitamin C as supplements contain substantially higher concentrations of ascorbic acid than fruits and vegetables. The toxicity of vitamin C displays symptoms such as heartburn, nausea, stomach upset and diarrhoea (Naidu 2003). It is, therefore, necessary to strive to obtain the maximum amount of vitamin C from food sources.
This thesis aimed at establishing the effects of freezing and canning processes on the concentration of vitamin C in vegetables. This knowledge is crucial in helping obtain maximum benefits from vitamin C rich vegetables. It also aimed at determining whether the residual content of ascorbic acid after processing was sufficient to meet the nutritional requirements.
Materials and Methods
The first experiment was carried out to establish the maximum wavelength (λmax) of the blue coloured product of the reaction between Folin-Ciocalteu and ascorbic acid. The reagents used were 10% trichloroacetic acid, 2.0 M Folin-Ciocalteu, 1 ml of water, and 0.200 mg ascorbic (stock solution). The 2.0 M Folin-Ciocalteu was diluted ten times using water. The tubes were thoroughly shaken and placed on ice for about five minutes then subjected to centrifugation at 3000 rpm for an extra 5 minutes. 0.2 ml of Folin-Ciocalteu reagent was added to the extract, after which the tubes were shaken thoroughly (Jagota & Dani 1982). The absorbance of the blue colour that developed was read at wavelengths ranging from 0 nm to 960 nm using a spectrophotometer. The recorded values were used to create a calibration curve of ascorbic acid.
The second experiment was done to determine whether the assay was linear. This was established using various concentrations of ascorbic acid ranging from 0 µg/ml to 200 µg/ml. The ascorbic acid standards were made in replicates of three (for each concentration). 90 ml of water and 2 drops of 0.2 M Folin-Ciocalteu reagent were also used. Water and ascorbic acid were mixed in varying quantities as shown in the following table.
Dilutions of Ascorbic Acid for the Determination of the Linearity of the Assay
The absorbance of the ascorbic acid standards was then read at 700 nm; the values were recorded and used to plot a curve showing the linearity of the assay. The linear range was found by checking the two concentrations that gave a straight line. The second part of experiment 2 was done to expand that linear range further. However, the concentrations of ascorbic acid used ranged between the two concentrations that gave a straight line instead of the earlier range of 0 µg/ml to 200 µg/ml. Water and ascorbic acid were mixed appropriately in varying quantities. The absorbance of the ascorbic acid standards was read at 700 nm. These values were used to plot the calibration curve that was used to establish the concentration of ascorbic acid in the samples.
Extracts from different types of vegetables (peas and carrots) in different states (fresh, frozen and canned) were obtained by homogenising 10g of the vegetables in 15 ml of water. Three samples of each vegetable in each state were prepared separately (in test tubes) to ensure reproducibility of the results. The samples were packed in identical containers, for example, the canned vegetables were in identical tins and the frozen vegetables were in similar bags.
The third experiment was carried out to compare the absorbance of fresh and frozen ascorbic acid standards. An ascorbic acid standard solution, at a concentration of 50 µg/ml, was made alongside different standards with concentrations ranging from 0 µg/ml to 50 µg/ml. Three ascorbic acid solutions of 10, 20 and 30 µg/ml (assumed to be the unknown solutions) were made. These unknown solutions were assayed together with the standard solutions in triplicates at 700nm. Some of the stock solution was frozen away and the assay repeated on a different day using the frozen standard solution. This was to give an indication of day-to-day assay variability due to the use of freshly prepared and frozen ascorbic acid stock solutions. The accuracy and precision of the assay was calculated.
Background tests for each sample were first carried out to confirm the absorbance of the samples without the inclusion of Folin-Ciocalteu. The background test for fresh peas and carrots was done in three stages. In the first stage, 200 ml of the fresh peas and carrot extracts were mixed with 0.8 ml of trichloroacetic acid. This was topped up with 1800 ml of distilled water. 0.2 ml of Folin-Ciocalteu was added to 2000 ml of distilled water, which was used as the blank. The absorbance value was read at 700 nm for the three vegetable samples. The second stage involved the addition of 400 ml of the fresh extracts to 1600 ml of distilled water, whereas the third stage entailed the addition of 800 ml of the extracts into 1200 ml of distilled water. The absorbance was also read at 700 nm. The background test for frozen peas and carrots and canned peas and carrots were also done in three stages following the same procedure.
0.8 ml of trichloroacetic acid was then added to 200 ml of the extracts in a test tube. The tubes were shaken for 1 minute and placed on ice for 5 minutes. The acid-extract mixture was then centrifuged at 3000 rpm for 5 minutes. The samples were checked for clarity or cloudiness and were found to be clear. The supernatant was carefully transferred to a different test tube to avoid disturbing the precipitate. 0.2 ml of the supernatant from each test tube was used to determine the concentration of vitamin C. The extract was diluted to 1800 ml using distilled water and 2 drops of Folin-Ciocalteu added after which the absorbance of the solution was established at 700 nm.
The recorded absorbance values of the different samples were then used to establish the concentration of ascorbic acid from the standard curve. The relationship between absorbance and concentration was established using Microsoft Excel 2007. This gave the calibration curves that quantified the concentration of ascorbic acid. Means and standard deviations of the assessed variables were also calculated. The differences between the food processing methods (canning, freezing, and unprocessed) were tested by compiling the percentages of ascorbic acid from each treatment and computing the means. The means of each two treatments were tested for differences using t-test at α=0.05.
Results
The calibration curve was found by plotting the values of concentration of ascorbic acid against recorded absorbance. It was observed that the overall absorbance of ascorbic acid increased as the concentration increased. However, the absorbance started declining at a wavelength of 700 nm. This was seen in the peak of the calibration curve. The maximum absorbance for the colour reaction of the reacting products, therefore, was established at 700 nanometres. The addition of a polynomial trend line to the curve revealed the overall trend of the curve.
Determination of the Linearity of the Assay
Each concentration of ascorbic acid had more than one point on the graph because the experiment was done in triplicates. The trend of the curve revealed that the assay was indeed linear at the initial concentrations of ascorbic acid. This was seen by the steady increase in absorbance as the concentration of ascorbic acid increased between the first two concentrations of ascorbic acid.
It was observed that the linear range was between 0 µg/ml to 50 µg/ml. This was further expanded using concentrations of ascorbic acid between 0 µg/ml and 50 µg/ml at a wavelength of 700 nm. The graph below shows the obtained plot of absorbance against concentration.
Absorbance against Concentration of Ascorbic Acid in the Linear Range
From the graph, the linear range was established to be between 0 µg/ml and 35 µg/ml.
Comparison of Fresh Ascorbic Acid and Frozen Ascorbic Acid Standards
It was observed that the absorbance of frozen ascorbic acid was slightly lower than that of fresh ascorbic acid. The means and standard deviations were calculated to establish the accuracy and precision of the procedure. The calculated values are indicated in the following table.
Mean and Standard Deviation Values for the Absorbance of Ascorbic Acid Standards:
The values of the standard error of the means were relatively low indicating that the experiment had an elevated level of accuracy and precision. This indicated that there were extremely little variations in the concentrations of fresh and pre-prepared and frozen ascorbic acid standards. These differences, therefore, did not affect the accuracy of the findings.
Sample Results

The concentrations of the ascorbic acid standards were considerably higher than in the carrot extracts. Fresh carrots had the lowest concentration of ascorbic acid followed by canned carrots. Frozen carrots, on the other hand, contained the highest concentration of ascorbic acid of the three samples. The slopes of the plots were proportional to the concentration of ascorbic acid. The figure above indicated that the slope of the ascorbic acid standard curve had the highest slope followed by that of frozen carrot, canned carrots, and finally fresh carrots.
The concentration of ascorbic acid in the samples was determined using the absorbance values and the equations of the lines. The equations of the lines were in the form y=m*x where ‘m’ was the gradient (slope) of the lines, ‘y’ was the absorbance, and ‘x’ was the concentration of ascorbic acid. The values of y and the gradients were substituted into the linear equations, and the concentrations calculated. The concentration of ascorbic acid in the undiluted samples of carrot extract were also determined. The tables below indicate the calculated concentrations of ascorbic acid in the various carrot extracts.
Concentration of Ascorbic Acid in Fresh Carrot Extract
Concentration of Ascorbic Acid in Frozen Carrot Extract
Concentration of Ascorbic Acid in Canned Carrot Extract
A comparison of the percentages of ascorbic acid in the carrot extracts revealed that frozen carrots had the highest proportion of ascorbic acid followed by canned carrots, whereas fresh carrots had the least concentration of ascorbic acid. The standard (ascorbic acid) contained the highest concentration of ascorbic acid.
The Concentration of Ascorbic Acid in Fresh, Canned and Frozen Peas
Concentration of Ascorbic Acid in Fresh Peas Extract
Concentration of Ascorbic Acid in Frozen Peas Extract
Concentration of Ascorbic Acid in Canned Peas Extract
The tables above indicate that the lowest concentrations of ascorbic acid were in frozen peas. Canned peas contained the highest concentration of ascorbic acid.
A Comparison of the Total Concentration of Ascorbic Acid in Carrots and Peas
The total concentration of ascorbic acid in peas appeared relatively higher than that in carrots from the observed means. This gave an indication that peas were a better source of vitamin C than carrots. This was proven by testing whether the differences in concentration were statistically significant. A two-tailed Student t-test was used to realize this. It was found that the differences were statistically insignificant (P= 0.288294, α= 0.05).
The Total Concentrations of Ascorbic Acid in the Three Experimental Treatments
The three treatments that the vegetable were subjected to (unprocessed, freezing and canning) were compared for their effect on the concentration of ascorbic acid. This was achieved by finding the total concentration of ascorbic acid of the vegetable samples in the three treatments. The differences in the means of the three treatments (fresh, canned, and frozen) were tested using the Student t-test at α=0.05 level of significance.
It was realized that the difference of ascorbic acid concentration between fresh and frozen vegetable samples was statistically significant (P= 0.025554, α= 0.05). The difference of ascorbic acid concentration in frozen and canned vegetable samples was found to be statistically significant (P= 0.009667, α= 0.05). On the other hand, the difference in ascorbic acid concentration between canned and fresh vegetable samples was found to be statistically insignificant (P= 0.508484, α= 0.05).
Discussion
The maximum absorbance for the assay was established at 700 nm. This was the point at which the maximum signal was obtained while avoiding interference from other molecules in the sample. In addition, at the maximum wavelength, the absorbance strength of light was at its highest, whereas the pace of alteration in absorbance with wavelength was at the lowest. This was an essential part of the experiment, which played a significant role in minimising experimental errors. The fundamental principle of spectrophotometry implied that a substance absorbed or transmitted light over a collection of wavelengths. This was witnessed by the range of absorbance that was recorded for ascorbic acid at various wavelengths. It was, therefore, necessary to determine the maximum absorbance wavelength to facilitate the use of optimum conditions in the assay.
The calibration curve revealed that the absorbance increased with the increase in concentration of ascorbic acid up to 50 µg/ml. The curve followed the Beer-Lambert’s law up to concentrations of 50 µg/ml. It was only possible to apply the Beer-Lambert’s law in an area of the standard curve that displayed a linear relationship between absorbance and concentration and that was why it was imperative to determine the linearity of the assay. The background tests were done to evaluate the selectivity of the assay and hindrances due to other compounds in the sample (Selimović, Salkić, & Amel 2011).
The assays indicated that the concentration of ascorbic acid was high in frozen and canned carrots, and was minimal in fresh carrots. This was because vitamin C was extremely sensitive to water, temperature and air (Rickman, Barrett & Bruhn 2007). It was approximated that a quarter of the vitamin content in foods was lost during blanching. A significant portion of vitamin C was lost during freezing and thawing of fruits and vegetables. It was thought that canning and freezing protected vitamin C from environmental factors hence the high levels of vitamin C that were observed in frozen and canned samples compared to the fresh samples. This was in line with findings by Rickman, Barrett and Bruhn (2007). It was shown that high quality food (grown in the best conditions) had a high organic content level. Such food had high chances of maintaining its nutritive value when frozen immediately after harvesting. This implied that numerous vitamins and minerals kept well in frozen foods, a phenomenon that accounted for the high ascorbic acid levels in frozen carrots. Commercial freezing of vegetables involved blanching for a short time to inactivate enzymes. Although freezing preserved vitamins, frozen foods were not supposed to be kept for extended durations in the refrigerator. This was because lengthy freezing periods degraded vitamin C as was seen in the study by Tosun and Yucecan (2007). They observed that freezing green beans and broccoli for 6 months caused a significant decline of vitamin C in the vegetables (Tosun & Yucecan 2007). The rate of loss of vitamin C increased with the increase in the length of freezing resulting in very low ascorbic acid content at the end of the 6 months.
However, the blanching process that usually took place before freezing was associated with a 25% decline in vitamin C content. This loss varied in different vegetables and accounted for the low ascorbic acid content that was observed in frozen peas. Nevertheless, the quantity of vitamin C preserved during freezing outweighed the loss due to blanching. According to Tosun and Yucecan, the various processes that took place before freezing affected the levels of vitamin C (2007). These processes included washing, cutting, slicing, and removal of tips. Such processes were not accounted for in the experiment. It was possible that these processes contributed to the observed levels of ascorbic acid in frozen peas and carrots. However, the magnitude of the pre-freezing processes was more evident in frozen peas than in frozen carrots.
The ascorbic acid content in carrots was lower than that in peas bringing about the notion that peas contained higher ascorbic acid content than carrots. According to a study carried out by C. R Feller et al. in 1935 peas were prone to high losses of vitamin C and lost more than half of their vitamin C content during the first 48 hours after harvesting (Haas 2011).
Canning helped in the preservation of vitamin C in peas more than in carrots. This was witnessed by the high percentage of ascorbic acid in canned peas compared with canned carrots. The canning process entailed heating vegetables for long periods of time (blanching). Although the heating process destroyed some vitamins, it helped in killing of harmful microorganisms such as botulism spores. The exclusion of heat from the process allowed such microorganisms to grow anaerobically and caused serious incidences of food poisoning.
It was not possible to determine the exact length of time the vegetable samples were exposed to environmental conditions before the assays were performed. There were no measures taken to quantify the loss that resulted because of pre-freezing procedures in the peas and carrots. It was also not possible to quantify the magnitude of vitamin loss that occurred before and after the treatments (as a difference between the initial vitamin concentration before processing and the final vitamin concentration after processing) since the initial concentrations of ascorbic acid were not measured. The assay only compared the effect of freezing and canning on the concentration of vitamin C after processing the samples. Obtaining the initial concentrations of ascorbic acid could enable the comparison of the vitamin levels before and after the treatment. It was, therefore, possible that large amounts of vitamin C were already degraded by the time the tests were performed. A report from the Food and Agriculture Organisation indicated that exposure of vegetables to basic conditions, copper ions, and iron ions reduced levels of ascorbic acid. An alkaline medium was an electron acceptor and accepted electrons from ascorbic acid causing a chemical reaction that depleted the levels of ascorbate. This was the reason that trichloroacetic acid was used in the extraction of ascorbic acid from the vegetable samples.
Fresh fruits and vegetables contained high amounts of water and interacted with microorganisms together with atmospheric oxygen. These interactions made fruits and vegetables prone to spoilage. Active food enzymes also interacted with oxygen and moisture. These two factors (oxygen and moisture) were part of the causes of food spoilage. Therefore, as much as canning resulted in the loss of some vitamins it played a significant role in preserving food. According to the Food and Agriculture Organization, cutting and bruising of fruits and vegetables freed the enzyme ascorbate oxidase (Rickman, Barrett & Bruhn 2007). Ascorbate oxidase catalysed the breakdown of ascorbic acid thereby reducing the concentration of vitamin C in fruits and vegetables. Blanching deactivated this enzyme thereby aiding in the preservation of ascorbic acid. Acidic conditions also played a significant role in preserving ascorbic acid and made pickling a great alternative of preserving food. The addition of chlorine to water used to wash vegetables increased the rate of loss of vitamin C. This was because chlorine was an oxidising agent that reacted with ascorbic acid (a reducing agent) in vegetables. This suggested that washing vegetables using water without chlorine helped in preserving vitamin C. A comparison of vitamin C content in fresh and canned peas and carrots also indicated that canning preserved a higher vitamin C content than fresh vegetables.
The differences of ascorbic acid concentration in frozen and canned vegetables and fresh and frozen vegetables were found to be statistically significant. This meant that freezing was an efficient method of preserving vitamin C content of vegetables. One of the reasons was because freezing slowed down the process of respiration in vegetables. Consequently, the slowed respiration prevented the consumption of nutritious constituents (Rickman, Barrett & Bruhn 2007). The inclusion of cold temperatures in frozen foods forestalled the growth of microorganisms, which utilised the nutritious constituents of food for their growth thereby contributing to the depletion of vitamin C content (Rickman, Barrett & Bruhn 2007).
On the other hand, the difference in ascorbic acid concentration between canned and fresh vegetable samples was found to be statistically insignificant (P= 0.508484, α= 0.05). This showed that although canning helped preserve vitamin C in vegetables it was not as efficient as freezing. Factors that contributed to the loss of vitamin C depended on the initial concentration of ascorbic acid. It was possible to obtain the highest concentration of ascorbic acid from fresh vegetables following harvesting (Haas 2011). Similarly, it was also possible to attain high quantities of vitamin C from frozen and canned vegetable samples if the proper pre-processing procedures were observed.
One of the aims of this thesis was to establish whether the residual content of ascorbic acid in vegetables was sufficient to meet the nutritional requirements. It was observed that the total concentrations of vitamin C in all the vegetable samples were above 20%. However, canned and frozen samples had higher percentages of ascorbic acid. According to Rickman, Barrett and Bruhn, any food source containing a fifth of the nutrient’s RDA value was a good source of that nutrient (2007). Therefore, this study showed that although some ascorbic acid was lost during processing, the remaining ascorbic acid content was sufficient to meet the nutritional needs. This was because ascorbic acid could not be stored in the body even if taken in large quantities due to solubility in water.
Conclusion
Fresh vegetables contained the least amount of ascorbic acid in all the test samples. Freezing as a method of processing had samples with the highest vitamin C content. It was concluded that vitamin C was indeed an extremely volatile nutrient, which ought to be consumed immediately after harvesting to tap the entire available vitamin C. People were advised to buy in-season fruits and vegetables sold by local farmers. This was because such food was likely to be fresh and contained a high amount of vitamin C. In addition, preparation such as cooking for those vegetables that required cooking ought to be carried out in the shortest time possible to maintain the nutritive value (Mapson 1952). This was because heating contributed to a significant loss of vitamin C content in vegetables. Washing of fruits and vegetables also needed to be done fast as continued exposure of fruits and vegetables to water caused leaching of vitamin C. Highly chlorinated water ought to be avoided when washing vegetables since chlorine contributed to the destruction of ascorbic acid. However, the residual amounts of ascorbic acid in the processed vegetables as determined by the assays were sufficient to meet the nutritional requirements. This was in line with the United States Food and Drug Administration (FDA), which characterised good vitamin C sources as foods with approximately 19 % of the RDA for that nutrient (Rickman, Barrett & Bruhn 2007).
References
Cass, H & English J 2002, User guide to vitamin C, Basic Health Publications Inc., North Bergen, NJ.
Haas, R 2011, Does storage time affect the vitamin C in fruits and vegetables? Web.
Hemila, H 1992, “Vitamin C and the common cold,” British Journal of Nutrition vol. 1992 no. 61, pp. 3-16.
Jagota, S. K & Dani H. M 1982, “A new colorimetric technique for the estimation of vitamin C using folin phenol reagent,” Analytical Biochemistry vol. 1982 no. 127, pp. 178-192.
Kreider, R. B., Leutholtz B. C., Katch, F. I., & Katch V. L 2009, Exercise and sport nutrition, Exercise and Sport Nutrition: Texas, USA.
Mapson, L. W 1952 “The effect of processing on the vitamin content of foods,” British Medical Bulletin, vol. 12 no. 1, pp. 73-77.
Naidu, K. A 2003, “Vitamin C in human health and disease is still a mystery? An overview,” Nutritional Journal, vol. 2 no. 7, pp. 1-10.
Padayatty, S.J., Katz, A., Wang, Y., Eck, P., Kwon O., Lee, J., Chen, S., Corpe C., Dutta A., Dutta S. K., & Levine M 2003, “Vitamin C as an antioxidant: evaluation of its role in disease prevention,” Journal of the American College of Nutrition, vol. 22 no. 1, pp. 18–35.
Rickman, J. C., Barrett, D. M., & Bruhn, C. M 2007, “Nutritional comparison of fresh, frozen and canned fruits and vegetables. Part 1. Vitamins C and B and phenolic compounds,” Journal of the Science of Food and Agriculture, vol.87 no. 6, pp. 930-944.
Rumelin, A 2006, “Vitamin C substitution in post-operative intensive car patient: indications and limitations,” in T Peel (ed), Vitamin c: new research, Nova Science Publisher, New York, pp. 1-22.
Selimović, A., Salkić, M., & Amel S 2011, “Direct spectrophotometric determination of L-ascorbic acid in pharmaceutical preparations using sodium oxalate as a stabilizer,” International Journal of Basic & Applied Sciences, vol. 11 no. 2, pp. 125-131.
Singh, R. P., Sharad, S., & Kapur S 2004, “Free radicals and oxidative stress in neurodegenerative diseases: relevance of dietary antioxidants,” Indian Academy of Clinical Medicine, vol. 5 no. 3, pp. 218-225.
Tosun, N. B & Yucecan, S 2007, “Effect of home freezing and storage on vitamin C content of some vegetables,” Pakistan Journal of Nutrition, vol. 6 no. 5, pp. 472-477.
Vitamins, minerals and supplements 2013, Web.