Introduction
When implementing any research, it is essential to understand the peculiarities of data and different ways to manage information. Researchers should make sure their studies are based on the analysis of the appropriate sample; otherwise, the reliability of the findings can be doubtful. It is important to set clear objectives and goals, which will be instrumental in identifying the most suitable sample and sampling techniques.
Type of Study
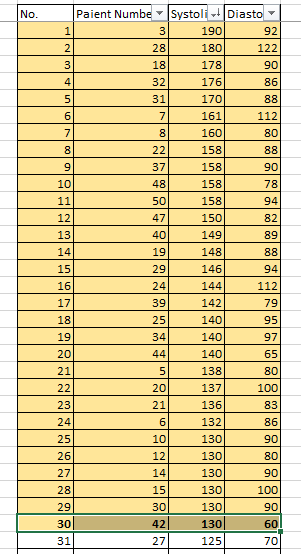
The data in question can be used in a random control study aimed at managing people’s hypertension. The overall number of patients is 50, and 30 people have high blood pressure, which makes 60% of the sample (see Figure 1). The prevalence of high blood pressure across the country is prevalent among people aged 60 or older. Therefore, it is possible to assume that the records of older adults are provided. The study can be quantitative, but it can also be qualitative as the sample is not large.
The effectiveness of a treatment can be examined based on the data under consideration. Patients can undergo some pharmaceutical or non-pharmaceutical treatment with the implementation of pre-and post-tests. The effectiveness of a training program aimed at improving patients’ lifestyles or self-care can also be evaluated. It is possible to carry out surveys and ask patients to complete questionnaires regarding certain aspects of their life or treatment.
Type of Sample
The sample is often referred to as a set of observations representing a larger population. The sample under analysis can be the representation of older patients who receive healthcare services at a particular doctor’s office. Simple random sampling could have been the method utilized to choose the patients. In terms of this approach, all the representatives of the entire group under analysis are listed, and then a specific number of people is randomly selected. For instance, the researcher can choose all older patients (those aged 60 or above) who had a regular check-up during a month. Out of these, the researcher could choose every tenth patient. In this way, each patient who had a check-up during the set period had an equal chance of becoming a participant in the study.
Population
It can be difficult to identify a particular population the blood pressures would be regarded as a sample of. However, it is more likely to be a community, although it is still possible that the data can represent the entire state or even country.
As mentioned above, the average prevalence of high blood pressure is 60% among the elderly. It is noteworthy that some populations are more vulnerable to the development of this disorder as Black people, overweight people, and those who have an unhealthy lifestyle are more likely to be affected. Therefore, the population can be a community that is racially diverse and characterized by the middle level of income. Low-income neighborhoods would have a different set of data, as more people of the age group in question would have high blood pressure.