Introduction
Patient waiting time, as is aptly described by various scholars, has varied dimensions to it. The two broad definitions, however, include the time the patient spends in the hospital waiting to be served plus the total contact hours with the doctor or physician (Katz & Larson, 1991). The other groups of scholars borrow from the idea that patient waiting-time is the time he spends in contact with the physician. In our paper, we borrow from the fact that patient life, especially in emergency operations, is wholly subjected to the reactions from the physicians.
The ABCs of reducing patient’s time in the hospital areas outlined below: stop keeping patients for prolonged periods in the waiting room, especially when the emergency rooms are full. One would rather have them in other hospital’s beds rather than making them sit while waiting for the doctor. The patients that are to be admitted should be registered while at their hospital beds. This would by a large margin reduce the total wait time the patients would have spent queuing for registration purpose and also reduce congestion. The emergency facility would also reduce patients’ waiting time by directing those whose medical needs are not serious to warrant an emergency response to other facilities within the hospital, or externally sourcing the services of a non-emergency care centre (Mowen & Licata, 1993).
Studies reveal that, in reality, a big number of patients ending up at the emergency units are rarely in need of urgent medical attention as it is thought to be. These, if redirected to the appropriate facilities, would ensure minimal congestion at the facility hence reduce the patient’s waiting time. The other factors that would reduce a patient’s waiting time involve internal mechanisms that identify patients that have minor needs using internal diagnosis and treatment. This, in a nutshell, involves categorizing the ER patients by the urgency of attention they need (Dansky & Miles, 1997). This process would need contribution from other highly skilled stakeholders in handling the patients, for instance; nurses and the intermediate staff to facilitate the administration of tests and look after the non-critical cases.
Other than the above, other procedures to be undertaken to reduce patients’ waiting time at emergency facilities are rather procedural. Among these procedures is revising the protocol for specimen collection, and adjusting tedious laboratory procedures. A reduction in the procedures done within the facility and relegating lab test procedures to the doctors on board reduce not only the costs but also reduces the patient’s waiting time. The facility could also hire phlebotomists who should always be on call in case they are needed within the facility.
The facility could also go tech-savvy, getting equipment that would assist in the monitoring and relay information on the availability of waiting rooms, or rather report on ’emergency waiting room hours.’ Some equipment that is already being used in some facilities can provide real-time data about the emergent waiting times and disseminate the information to potential patients through media such as text messaging. This will assist in filtering between patients with immediate needs and, therefore, control overcrowding in these places. Lastly, on the issue, if the facility could increase the number of emergency staff they will serve a larger number of patients at once; hence facilitate lengthy emergency operations by dedicating this duty to other physicians.
With regards to the scope of this paper, our main focus is on operations of a Canadian based hospital- British Columbia Cancer Agency’s Vancouver Center (BCCA). To this, we narrow down to ambulatory care unit services. Fundamentally, our main interest is on some variables that are a function of a patient’s waiting time.
Hospital organization
A patient’s journey through the facility is not particularly distinct as compared to the rest. The typical processes in place when patients knock on these doors are as below.
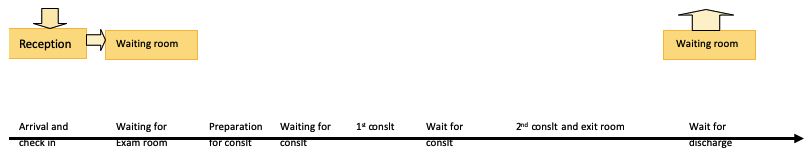
When a patient arrives, his/her first stop is at the reception. The victim’s particulars are recorded in an entry booking system which is normally availed to both nurses and doctors who will attend to the given patient. He/she then enters into the waiting room. This is in some instances a large hall to accommodate, sometimes, a large number of patients at the facility. The patient waits there pending a physician’s call after which he/she will be directed into the examination by either a nurse on duty, a volunteer, or somebody who has accompanied him/her. They will assist the patient fill out his basic information that normally involves the general issues such as weight and the general state of the patient in the patients’ record. This information is left behind with the patient as his/her attendee leaves the office for the physician’s perusal. Physicians get into the room to attend to the patient, and these interactions could be several since there may be multiple consultations by the physicians. After this, the patient is allowed to leave the room, and if by chance, the physicians need to make multiple consultations, the patient is normally advised to stay put and wait for the next physician. Consequently, the patient exits the room.
In case they need to make arrangements for future visits, the patient will have to get back to the waiting area (Taylor & Benger, 2004). On the other hand, the physicians or doctors will get back to their rooms/offices and make preparations in the form of orders for tests on future appointments they might have or even about that particular patient. These will then go through to the nurses for processing after which the nurse institutes the doctor’s orders. The nurse then gives the patient an appointment card and releases him/her to go. Further activities such as the very vital patient education and sometimes administration of injections occur at the nursing assessment rooms (Trout & Magnusson, 2000).
On a normal day at the facility, there are three operational oncology facilities. Each of them is run by a separate oncologist with assistance from other colleagues such as physicians. The clinics perform their duties separately, although both relate to the activities within the facility. Each of them boasts an examination room, a station for nurses and the last one is for the clerical staff. Exam rooms usually add up to 45, 24 of these are for oncology, 16 for radiotherapy and five for surgical operations (Thompson & Yarnold, 1995). This sophistication in the operations of these vast facilities that make operations flow smoothly is sometimes its undoing, given the fact that there are several exam rooms per clinic. Allocation of these rooms could be slow, resulting in excess idle time for a given physician at the facility. However, if a balance is struck and operations flow harmoniously, they might serve a large patient workload without feeling a pinch.
Aptly stated as is in our introduction, our main objective of doing this research is to analyze some of the parameters that sum up what would be a patient’s ‘lost-time’ owing to a delayed physician response. Eventually, this will shed light on the rational steps that need to be incorporated in to mitigate this.
Literature review
On the forefront towards the delivery of an effective system that ensures patients are served at best suitable time and to ensure they attain proper care, stakeholders in the same field and governments alike are working towards the establishment of an effective system that would put the casualties at the heart of emergency services. The major contribution to this overcrowding in the emergency department, as McHugh et al. put it, is a contribution of a variety of factors, but chiefly stem from an inefficient patient flow system. These are revealed from the resulting outcomes to the overall operations of the facility; for instance, the effects to overcrowding would compromise on the delivery of quality, care services rendered. This is attributed to the disorganization that results, and this hampers effective movement and general operations by the physicians. Overcrowding, in the long run, is too costly for the company given that the disorganization and slow process results in loss of man-hours by an employee or physician. Community trust is reduced as the crowds sometimes get too close to the physician’s contact with the patient and hence; the patient negates to relay some useful information. This may lead to an improper diagnosis. All these, as listed above, are mitigated by improving the patients’ flow (McHugh et al., 2011).
Hypotheses
This paper seeks to expound on the variants to the time taken to serve clients. In this experiment, we set to find out the factors that lead to a patient’s attendance delays in ambulatory care units (ACU’s). We also try to get information that would help us in trying to improve the performance of ACUs. This would, in turn, limit patients’ waiting time while at the same time, enhance the effective utilization of resources and appointment times. As such, this drives us to our null hypothesis (H0) which states that there is no significant difference on a patient’s waiting time for appointment scheduling, resource allocation and the hospital’s operations.
Research Methodology
In the build-up to this, the idea was to try and employ a procedure that would capture all these variables. The only way to get the effect of delays was to get to patients and the staffs alike, get their opinion on the above and compute the data using statistical approaches. I had to use secondary data in this research; this means I had to use an already analyzed data on the same owing to insufficient time for data collection.
The secondary data was obtained accordingly as follows: the correspondent had to gain access to the mapping of the facility and identify the zones he could get respondents. The types of respondents included patients who had come on an appointment basis, those who were there on first visits and those who have been there for quite some time. While administering questionnaires observations were made by the correspondent regarding the different occasions in the facility and the reaction of patients, for instance, when there is a high number of people to when there are a few or none at all. The above-outlined parameters were used to design the questionnaire, with a determinant of how they would place themselves and how to conduct themselves.
Finally, the most crucial part, time study, was designed for the purpose of obtaining data on the patient’s waiting time, admission durations, and resource utilization. This was achieved courtesy of a high-level process chart shown above (Fig. 1). The respondents obtained in the process were over 600 patients. Notably, from the above information, a summary on arrival times, physician-patient contact time, preparation and turn-around times and the visit typology were obtained. Importantly, each stage was either classed as value-added or wastes (the stages in the process where waiting was involved). From a preliminary analysis on resource utilization, a computer simulation model had to be developed to capture a diversity of scenarios while incorporating all the parameters studied. This was after validation. Later, analyses, which were grouped as appointment, operational, resource allocation and scheduling, were analyzed.
Results and Analysis
Analyses incorporating all the case scenarios as exhibited by the simulation model portray that there was room for improvement. This will only happen when there is effective resource utilization cum reduced patient’s waiting time. As portrayed in the figure below (graph 1), of a computer simulation of different case scenarios, the best cases are exhibited by the non-inferior plots joined by the red line. In effect, these cases exhibited a significant drop in waiting time (from initially 21 to 6.4 minutes). However, the clinic duration time was extended by a paltry 10%. To this, graph 2, as presented below, echoes these findings. Importantly, the current hospital situation, as depicted by graph 1 is the point of intersection where the axes meet.
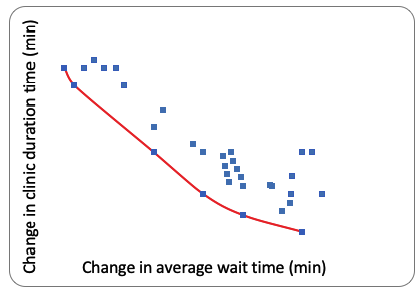
For this graph (2), the more we go eastwards the efficient a case scenario, in terms of reduced waiting time, is engendered. An analysis of a patient’s wait time changes significantly for the selected cases. For this case, the patient’s waiting time reduced by a margin of up to half an hour.
ANOVA analysis performed at 95% confidence interval revealed that there was a significant difference among the different factors in the key metrics.
Discussion and Conclusion
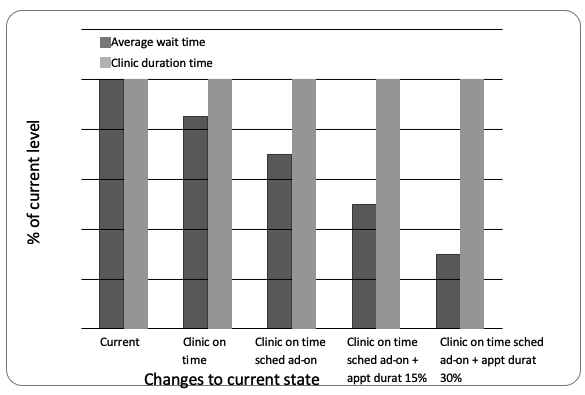
The objective of this paper was to analyze some of the parameters that sum up what would be a patient’s ‘waiting time’ owing to a delayed physician. From the analyses exhibited by a computer simulation model, several implications can be made in this regard. The findings showed that time of commencement in operations of the clinic has a significant impact on a patient’s waiting time. From the simulations, it was established that punctuality could reduce this waiting time by an average of 15% (translating to 3.1 minutes). While focusing on the appointment order, it was established that this had little or no impact on a patient’s waiting time. This is owed to the fact that the ACU clinics, “which comprise mostly ‘Follow-up’ appointments and do not mix appointments frequently, make the appointment order less relevant” (McHugh et al., 2011).
When bringing the appointment adjustments into a spectacle, the simulation model revealed that a rigid appointment period is a factor that would significantly affect a patient’s waiting time. In effect, this would force these appointments to be planned wide apart, consequently hindering time overlap. This, in turn, translates to a reduced waiting time (reduces by 43% or 9 minutes). As portrayed in the graph (2) above, the impacts of add-ons on the schedule has a significant effect on the waiting time. Just like appointment adjustments, this one hinders a probable appointment overlap and hence waiting time. According to the imitation, this achieves a 3.8 minute time reduction. Finally, while focusing on resource utilization otherwise ‘Pod Configuration,’ the simulation model which analyzed two parameters- “pool of shared rooms vis a vis a perfectly designated room per clinic,” (McHugh et al., 2011) showed a significant difference in resource utilization devoid of affecting waiting time.
In a synopsis, the above factors, including appointment scheduling, operations efficiency in terms of planning and effective resource utilization, are vital in reducing patients’ waiting time. Thus, these form the critical components in efforts fronted to stem patients’ waiting time.
References
Dansky, K.H., & Miles. J. (1997). Patient satisfaction with ambulatory healthcare services: waiting time and filling time. J of Hospital &Health Services Administration, 42 (2):165-177.
Katz, K., & Larson, B. (1991). Prescription for the waiting line blues: entertain, enlighten, and engage. Sloan Management Review, 32 (2), 44-53.
McHugh, M., Van Dyke, K., McClelland M., & Moss, D. (2011). Improving Patient Flow and Reducing Emergency Department Crowding: A Guide for Hospitals. Rockville, MD: Agency for Healthcare Research and Quality.
Mowen, J. C., & Licata, J. W. (1993). Waiting in the emergency room: how to improve patient satisfaction. J Health Care Mark, 13 (2), 26-33.
Taylor, C., & Benger, J. R. (2004). Patient satisfaction in emergency medicine. Emerg Med. J, 21 (5), 528-532.
Thompson, D.A., & Yarnold, P. R. (1995). Relating patient satisfaction to waiting time perceptions and expectations: the disconfirmation paradigm. Acad Emerg Med, 2 (12), 1057-1062.
Trout, A., & Magnusson, A. R. (2000). Patient satisfaction investigations and the emergency department: what does the literature say? Acad Emerg Med, 7 (6), 695-709.