Introduction
A normal distribution is a crucial concept in statistics as it can be applied in different contexts to solve various problems. For instance, this method can be utilized to evaluate a medicine’s effect on a patient’s health. In the given scenario, the use of contraceptive drugs in women is studied. The purpose of this essay is to explain whether blood pressure is a continuous or a discrete variable, provide histograms for blood pressure, and identify the benefits of normal approximation for data analysis.
Part 1
In the suggested study, blood pressure presented in Table 2A would be a continuous variable because it is obtained through measurement and not by counting. According to Nandi and Sharma (2020), “discrete random variables have a countable number of possible values,” while “continuous variables, on the other hand, can take infinitely many values” (p. 149). In other words, systolic blood pressure can be represented by multiple values and include fractional amounts. Similarly, body mass and height fall into the category of continuous variables since they do not have a specific numeric value (Nandi & Sharma, 2020). Alternatively, if the number of women in the groups of non-users and users was known, such a number would be a discrete variable. It would be possible to count how many female representatives are there in each category, which helps establish the number of possible outcomes.
Part 2
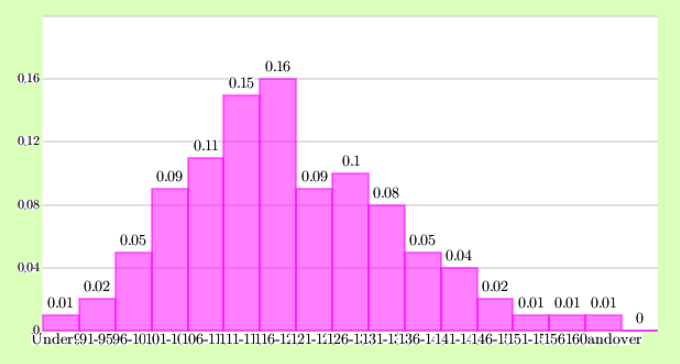
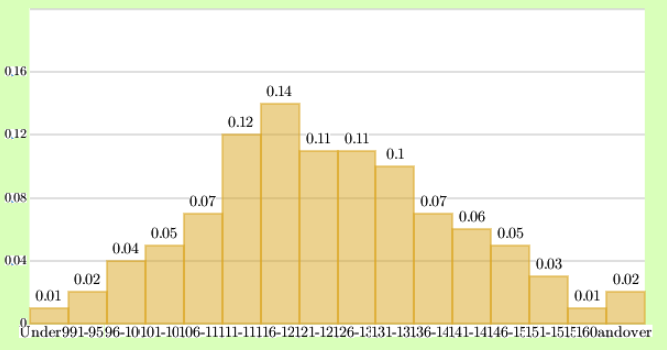
There are various methods of data visualization that are used to illustrate relationships between the variables. In healthcare, it is essential to recognize patterns, and the use of data visualization tools can help interpret numbers in a more efficient way. Nandi and Sharma (2020) note that “a histogram displays data distribution by creating several bars over a continuous interval,” which can be used to evaluate the concentration of the data (p. 73). Based on the health data provided in the given scenario, two histograms were drawn to present the blood pressures of two groups of respondents. Figure 1 shows that the average blood pressure range for the non-users of the pill range is 116-120. As shown in Figure 2, more pill users had higher blood pressures than the previous group, ranging between 116-120 and 131-135. To conclude, the histograms demonstrate that the use of a contraceptive drug by women aged 35-44 is likely to increase systolic blood pressure.
Part 3
A normal approximation of data is beneficial for assessing users’ data since it allows for estimating probabilities for the selected group. To evaluate the percentage of women with blood pressure in a certain age group, one should establish the total percentage of users and categorize blood pressures based on equal ranges that do not overlap. The next steps would be to measure women’s blood pressure, create a frequency distribution table, and draw a histogram for data interpretation.
Conclusion
To conclude, the use of variables and the creation of histograms can be helpful for interpreting health care data. The given case study demonstrated the difference between continuous and discrete variables and emphasized the importance of data visualization for establishing patterns. Furthermore, it was determined that the use of contraceptive drugs in women aged 35-44 is likely to increase their risk of higher blood pressure.
Reference
Nandi, G., & Sharma, R. K. (2020). Data science fundamentals and practical approaches: Understand why data science is the next. BPB Publications.